
TimeSeriesLogger (class)
A class for keeping track of numerous pieces of data over time throughout a process. It's designed to be easy to use and relatively quickly. It logs numeric types of any size (scalars, vectors, or matrices), as long as the size is consistent from sample to sample.
Overview
Let's start with a quick example of a random walk.
Example
log = TimeSeriesLogger(); % Make a new logger.
x   = [0; 0];
for t = 1:100             % Make a random walk.
  x = x + randn(2, 1);    % Take a single step.
  log.add('walk', t, x);  % Log a single sample, x, at time t.
end
log.plot();               % Plot everything.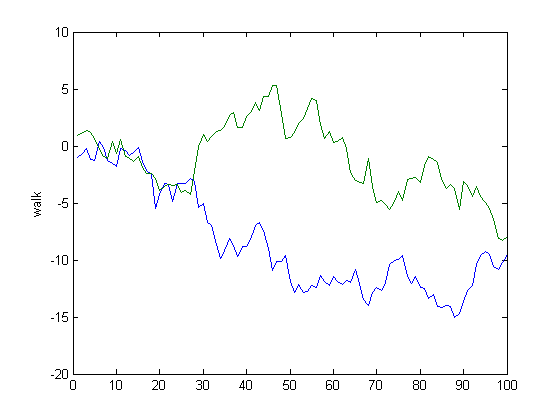
We can also access specific logs by their names. In the above, we only have one log ('walk'). Let's get that log from the logger.
[t_log, x_log] = log.get_log('walk'); % Get a specific log.
plot(x_log(:, 1), x_log(:, 2));       % Do something with it.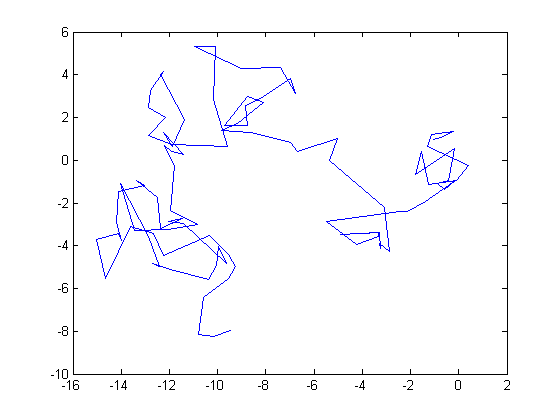
We can make sure a log exists before trying to do anything with it:
if log.contains('walk')
  x_log = log.get_log('walk');
  plot(x_log(:, 1), x_log(:, 2));
end
Options
If we want to log something but don't want it plotted when we call plot, then we can pass in false to the logger when we add the signal.
log.add('var1', t, x, false);To group items into different figures when they're plotted, give them “groups”:
log.add('var1', t, x, true, 'group1');
log.add('var2', t, y, true, 'group2');
log.add('foo',  t, bar, true, 'group1');
All of the items with common group names will be added to the same figures as subplots.
Re-Initialization
Finally, we can clear out the logger with initialize. This deletes all data and returns the logger to its initial state.
log.initialize();Methods
Overview
| add | Add a single data point to a time series. |
|---|---|
| contains | See if a time series exists (by name). |
| get_log | Return a log by name. |
| initialize | Clear out all data. |
| plot | Plot the logged series. |
add
Add a new log or append to an existing log by name.
log.add('var1', t, x);
log.add('var1', t, x, true);  % Show log in plots (default)
log.add('var1', t, x, false); % Don't show log in plots
Signals can be grouped together into figures by given them a common group argument. Here, both var1 and var2 logs will be plotted together.
log.add('var1', t,  x, true, 'group1');
log.add('var2', t2, y, true, 'group1');
This function returns true iff a new log was created.
status = log.add('var1', t, x);The signals are stored as time-data pairs, {t, x}, where each row of x corresponds to each row of t. So data{k}{1} contains the logged times for the kth signal, and data{k}{2} contains the data for the logged signal.
contains
Return true iff the log contains this name.
result = logger.contains(this, name)get_log
Return a specific log by name.
If one output is request, it returns the data. If two are requested, it returns the time and the data. Returns empty if the logs don't exist (use the 'contains' function to test for this).
x = log.get_log('signal1');
[t, x] = log.get_log('signal1');
Note that t will be ns-by-1 and x will be ns-by-nx, where nx is the number of elements in a single sample.
initialize
Clear everything out and start fresh.
log.initialize();plot
Plot all of the signals, grouped appropriately into figures.
log.plot()A custom x label can be added to figures as well.
log.plot('Time (s)')Notes
TimeSeriesLogger was created as the logging mechanism for odehybrid. However, it's not dependent on that project and so can be used anywhere.
TimeSeriesLogger is not related to the timeseries class in MATLAB.
Since this is such a simple class, all properties are public, preventing the need for getters and setters. However, under normal use cases, there would be no reason to access any properties of the class.
Since this class never knows how much more data is going to be logged, it can't preallocate the appropriate amount of space. However, increasing the size of its data stores by one row every time a new sample is added is very slow. To combat this, the data store starts off small and doubles whenever the store is at capacity. Say we're logging a 4x1 signal. When the first sample is added (say it's log k), data{k}{2} will be 1x4. When the second signal is added, it becomes 2x4. For the third, it's 4x4, then 8x4, 16x4, etc. A separate counter stores how much of this allocated space is currently used. This reduces the number of allocations from n to log2(n). Practically, it saves a little time during logging without too much complexity.
See Also
ExamplesFebruary 4th, 2023
©2023 An Uncommon Lab